
Lissajous curves are graphics produced by parametric equations and they are very useful on electronic circuits maintenance.
What are parametric equations?
They are equations where cartesian coordinates (x, y and z) are in function of independent variables called parameters. Usually, parameters are represented by the letters t or θ. These equations decribe curves and forms.
Examples of parametric equations of a straight line:
x=t+9
y=2t-1
Examples of parametric equations of a Lissajous curve:
x(t)=2cos(bt)
y(t)=4sen(at)
Lissajous curves
They were discovered in 1815 by the American mathematician Nathaniel Bowditch. Later, the French mathematician Jules-Antoine Lissajous studied the curves independently and with more details in 1857. These curves are the result of combining two perpendicular oscillations, as shown in the following video.
Interpretation of Lissajous curves
Lissajous curves allow to observe the comparison of phases between periodic signals.
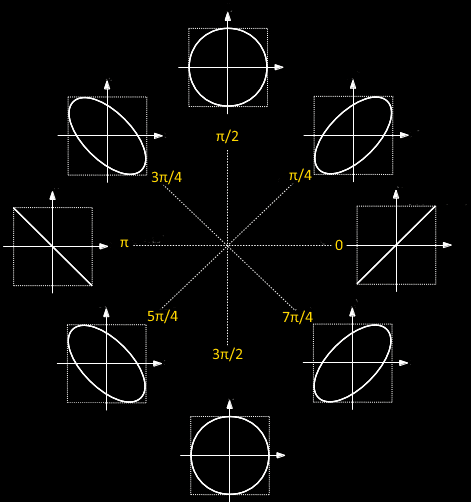
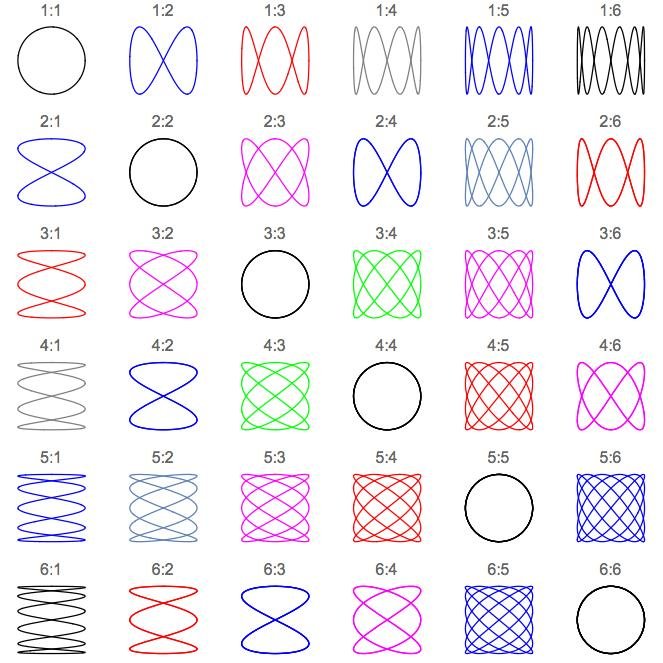
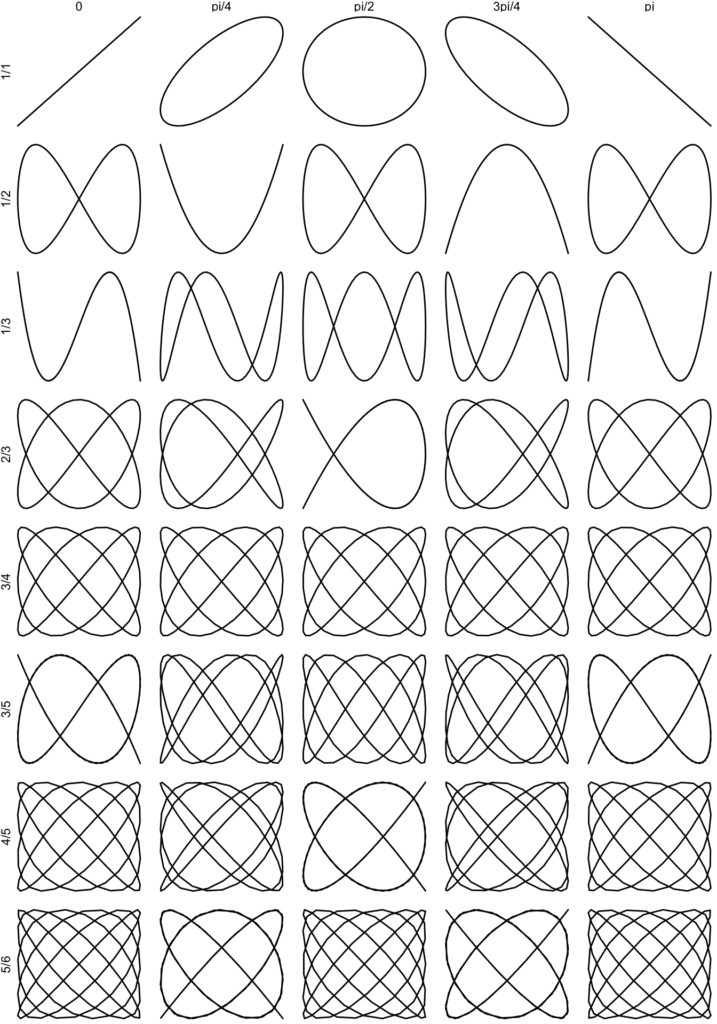
With these curves, it’s possible to measure AC signal parameters, through comparison with other signals, helping on electronic circuits diagnostic.
Harmonograph
It’s a mechanical machine which draws geometric figures with the motion of two or more pendulums. These pendulums can either move the pen across the surface or move the surface itself. In this way, the machine can produce Lissajous curves.
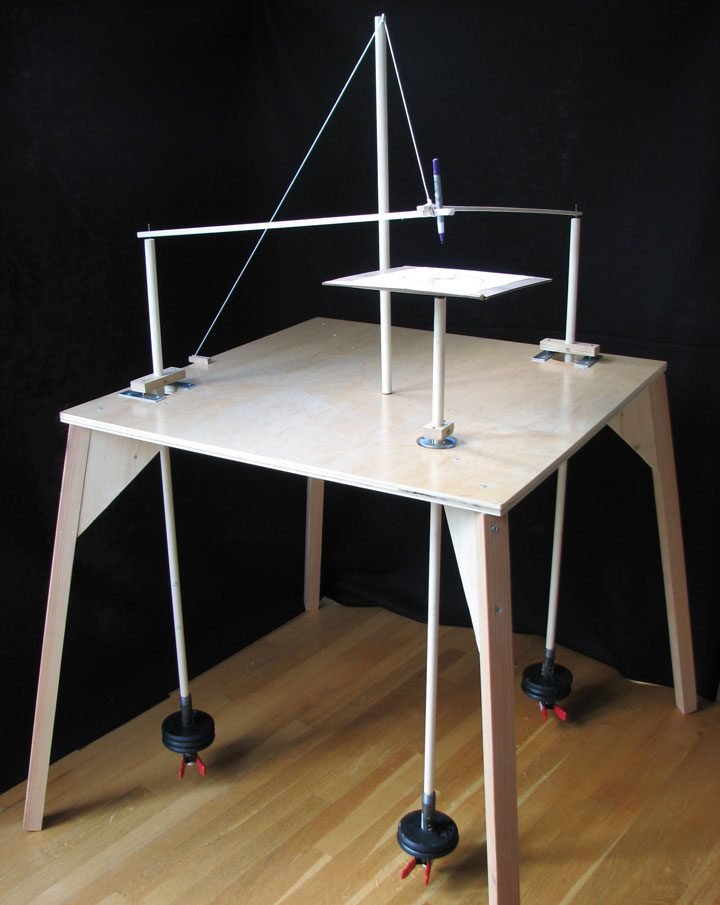
In some harmonographs, the surface is static and three pendulums control pen’s motion.
Generating Lissajous curves on oscilloscope
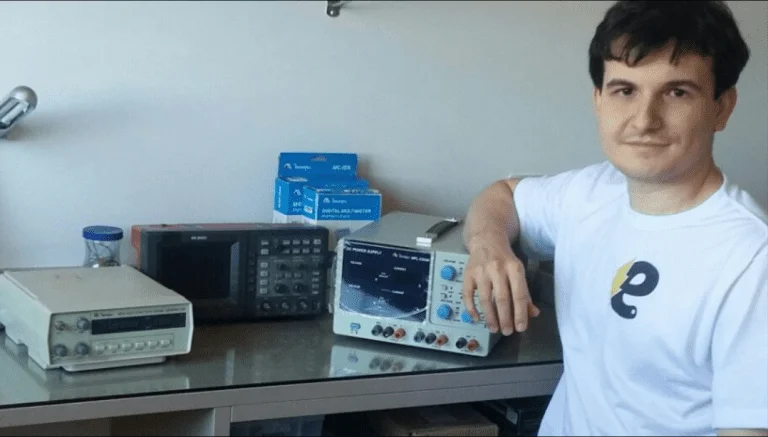
To generate Lissajous curves on the oscilloscope, simply change the display from time-based to XY mode. To create the Lissajous curves on my oscilloscope, I used my bench function generator and another generator I built based on the XR2206 chip.
Function generator XR2206Click here
In the first part of the video, the larger function generator with RC and RL filters are used to produce curves with the input and output of the filters. Meanwhile, in the second part, two different generators produce the patterns.